Written in March 2022.
It’s hard to lead “normal” lives to confront the “new normal” as the COVID-19 pandemic sweeps across the nation and the rest of the world. Aside from social distancing, many of us do want to use our skills to help, as we spend more time at home.
This blog is meant to provide some starter or ideas around how to begin analyzing the COVID-19 Open Research Dataset (CORD-19) that compiles scholarly articles on coronaviruses. I first learned about this dataset because multiple tech giants and other organizations have partnered together (a rare effort) to create this dataset. They launched a Kaggle challenge which you can read more about here .
About the data
As mentioned, this data is text-based and is provided in json format. There are three data files altogether: peer-reviewed commercial use subset (9000 papers), peer-reviewed non-commercial use subset (1973 papers), and another non-peer-reviewed dataset (803 papers). In this post, I will be using the Databricks environment to analyze the dataset for commercial use, since it has more files than the other two.
comm_use_subset.printSchema()As you can see, the file is very deeply nested. You can already tell by now, cleaning this data would be a significant undertaking. But I am going to take the easy way out here for now, and show you how we can very quickly make use of the data in its current state and generate some simple Natural Language Processing (NLP) analysis.
Many associate NLP with deep learning now and I won’t blame them, because deep learning is indeed a very powerful tool in analyzing text. However, I am going to show you simple NLP approaches with and without deep learning methods.
Non-deep learning
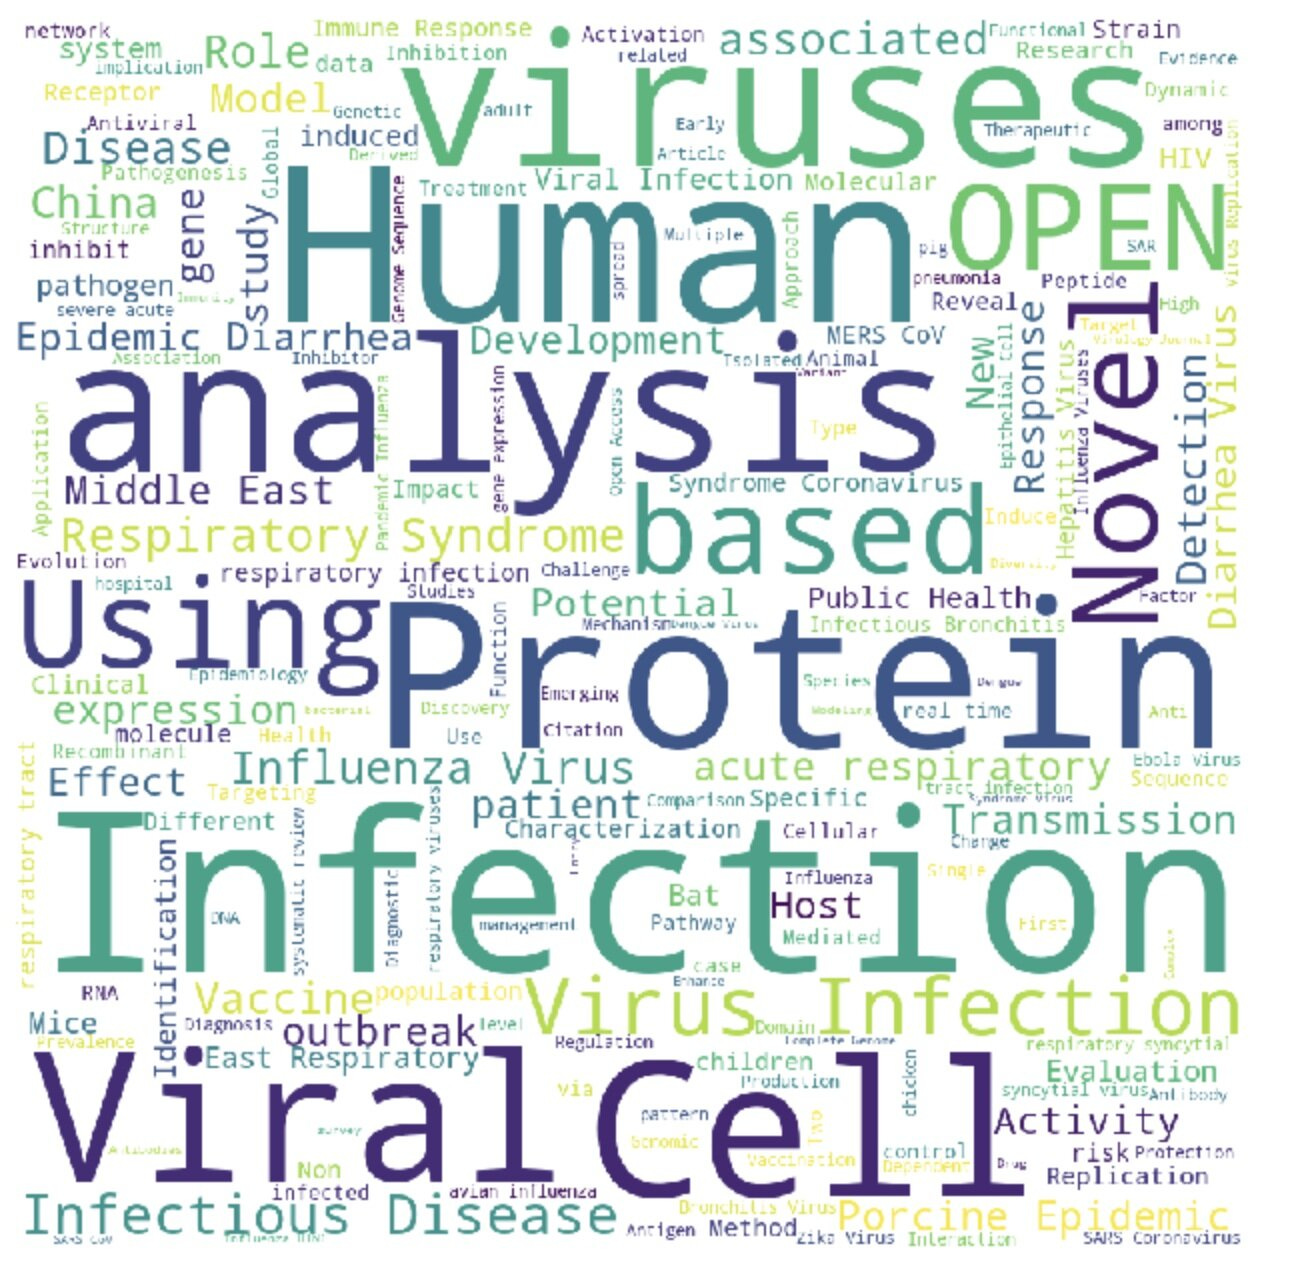
Say that I am interested in knowing, at a glance, which are the most common words that appear in all the titles of these peer-reviewed papers. I can generate a word cloud.
comm_use_subset.select("metadata.title").show(3)First, I concatenated all the available titles of papers.
from pyspark.sql.functions import concat_ws, collect_list

all_title_df = comm_use_subset.agg(concat_ws(", ",     collect_list(comm_use_subset['metadata.title'])).alias('all_titles'))
display(all_title_df)
Then, I wrote a simple function to plot a word cloud leveraging existing Python library called wordcloud. I first tokenized the text, by splitting the sentence into individual words. Next, I utilized the default set of stopwords and removed any stopwords accordingly. The WordCloud().generate() function calculates the number of instances each word appears. This means that the size of words in the word cloud we see later is a direct reflection of the frequency of the word in the text.
def custom_wordcloud_draw(text, color = 'white'):
    """
    Plots wordcloud of string text after removing stopwords
    """
    cleaned_word = " ".join([word for word in text.split()])
    wordcloud = WordCloud(stopwords= STOPWORDS.update(['using',   'based', 'analysis', 'study', 'research', 'viruses']),
                  background_color=color,
                  width=1000,
                  height=1000
                 ).generate(cleaned_word)
    plt.figure(1,figsize=(8, 8))
    plt.imshow(wordcloud)
    plt.axis('off')
display(plt.show())wordcloud_draw(str(all_title_df.select('all_titles').collect()[0]))As you can see, there is quite a number of non-meaningful words in the word cloud, e.g. “using”, “based”, “analysis”, etc. Let’s try to remove some of them by making a very minor change to our wordcloud_draw function: call the function UPDATE on STOPWORDS to add these custom stopwords.
def custom_wordcloud_draw(text, color = 'white'):
    """
    Plots wordcloud of string text after removing stopwords
    """
    cleaned_word = " ".join([word for word in text.split()])
    wordcloud = WordCloud(stopwords= STOPWORDS.update(['using', 'based', 'analysis', 'study', 'research', 'viruses']),
                      background_color=color,
                      width=1000,
                      height=1000
                     ).generate(cleaned_word)
    plt.figure(1,figsize=(8, 8))
    plt.imshow(wordcloud)
    plt.axis('off')
display(plt.show())custom_wordcloud_draw(str(all_title_df.select('all_titles').collect()[0]))Yayy! We successfully removed the non-meaningful words we are not interested in.
Now, let’s move onto NLP analysis using deep learning methods.
Deep Learning
We are going to use a summarizer model trained on BERT and also K-means clustering that initially was used to summarize lectures! Refer to this paper to read more about it. To use this library, you need to pip install bert-extractive-summarizer.
As with all machine learning models, you should be well aware of your model’s limitations. For this summarizer model, the known limitation is that it does not do well at summarizing text that has over 100 sentences.
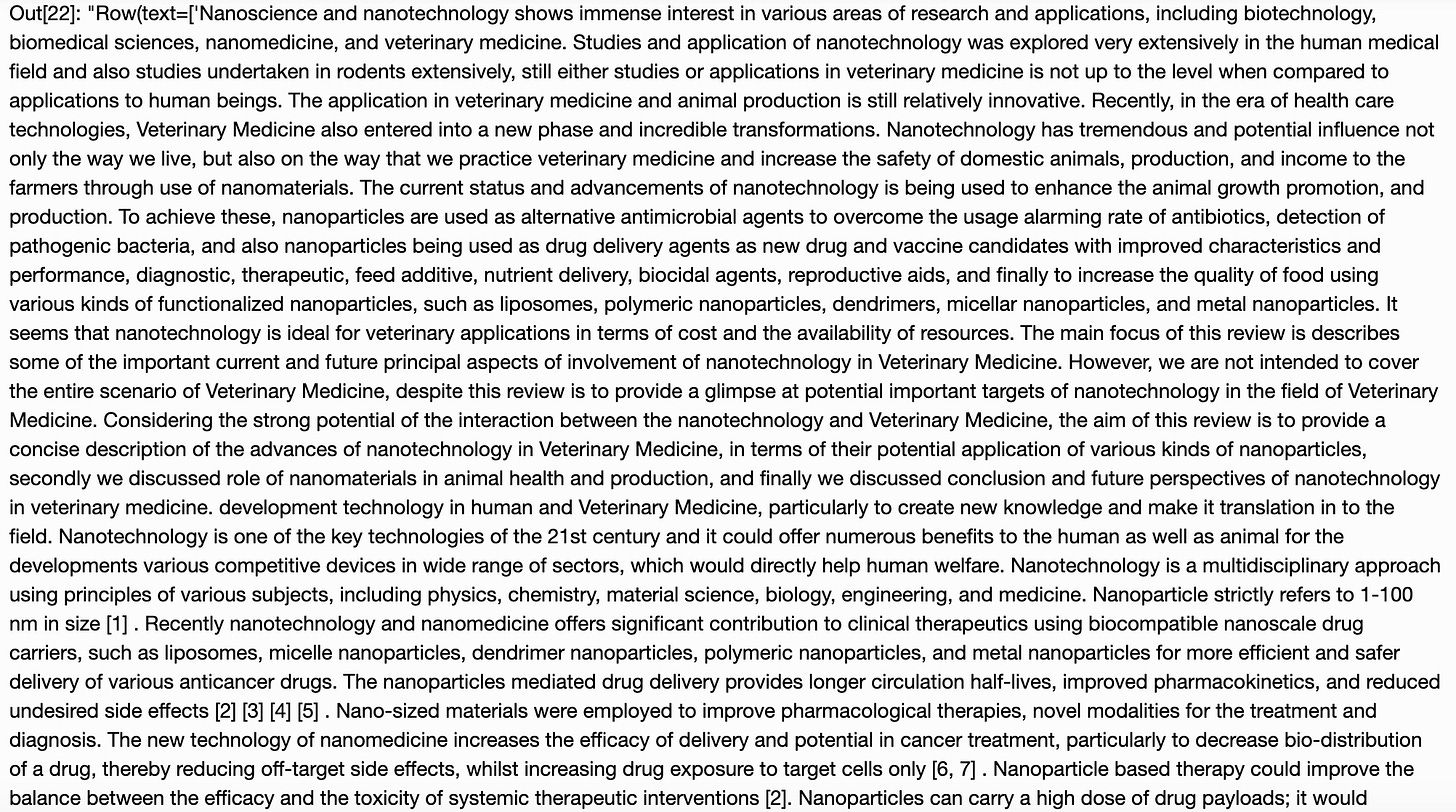
In this section, my goal is to summarize abstracts of papers, so that I need to read even fewer words to get the gist of the paper!
Let me start by reading the abstract of one of the papers.
from summarizer import Summarizer

abstract = str(comm_use_subset.select("abstract.text").take(2)[1])
abstractNow, let me train a summarizer model and remove any sentences that has fewer than 20 characters using the min_length parameter.
model = Summarizer()
abstract_summary = model(str(abstract), min_length=20)

full_abstract = ''.join(abstract_summary)
print(full_abstract)
max_length parameter to see if your summary looks different from mine!The End
By now, hopefully you feel more motivated to start your own analysis, without letting the messiness of this dataset deter you! You probably noticed that I didn’t clean my data at all prior to performing these two quick-and-dirty NLP methods (generating a word cloud visualization and an abstract summary). Yes, these two results don’t yield much actionable insight. But, hopefully this has helped you jumpstart some of your own analysis! You may try to cluster the categories of papers on coronaviruses published out there, so that other researchers can direct their effort to less well-studied areas!
If you are interested in non-NLP analysis on this particular dataset, check out the Youtube video that I shared. There are coding notebooks linked in the Youtube description too.
It’s hard to stay hopeful these days, but I hope the utmost hope that this disorienting and disheartening COVID-19 situation will soon come to pass! I hope you and your loved ones are able to draw near to each other and stay healthy!
Code Repository
Code presented in this post is available on my GitHub.
My other friends and I presented our analysis on coronavirus-related data at a webinar, feel free to checkout this Youtube page for the walkthroughs. They have also provided their notebook links in the webinar description as well.


